Let the Engine Yard Cloud dashboard and SSH access help you
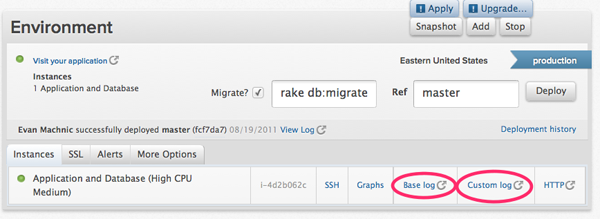
A common web application frustration almost everyone can understand is the headache associated with discovering your site is down. The discovery that your site is down can encompass a wide spectrum of situations ranging from 404 errors, to a 500 internal server error, to a no response timeout. What may be even more frustrating, is the fact that you do not always know exactly what the issue is, or how to tackle it, even if you later discover it is merely a trivial error. In this post I’ll walk through ways the Engine Yard Cloud dashboard and SSH access can help users gain better visibility into the issue or issues resulting in site downtime. ###The Engine Yard Cloud dashboard Before we begin, it’s important to keep in mind that the following steps assume there are no technical issues with the Engine Yard Cloud platform itself. For Engine Yard Cloud system level issues, we recommend following @eycloud on Twitter and subscribing to the Release Notes feed. ###Start with visual inspections From the Dashboard homepage, do you see a red status indicator? This designates that your EC2 instance is experiencing problems. A few things can cause this problem. So, how do you figure out why? Click on the environment that has a red status indicator. As you can see the environment below displays a red status indicator.

Now you can view a handful of logs to diagnose the problem. If a problem was caused by pressing the Upgrade button, the Base Log will display the reason for it. It may be necessary to check the Custom Log if you are using custom Chef recipes.

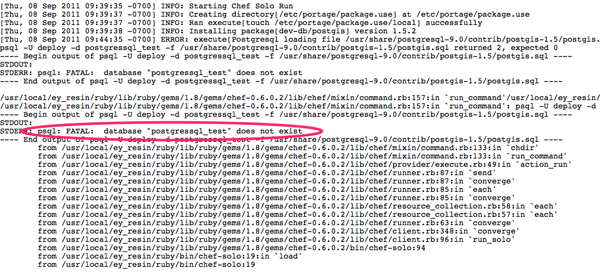
For example, this particular error was caused by a typo in the custom chef recipe. Here is the custom log displaying the error. The database name was spelled incorrectly in this case.

More often than not, the errors are descriptive enough to resolve once you have identified them. Once you have fixed the error, you will need to “Apply” the changes.
 ###What else could be wrong?
Your next discovery may be found in the alerts tab. Alerts offer you useful information about heavy load, high memory usage, low disk space, etc. For example, if you discover you are running out of memory, you may decide to scale your environment or modify your application in order to resolve such issues.
 ###I see a green status indicator and there are no alerts
If this is the case, there is a strong possibility that your application deployment failed. Let’s visit your application’s View Log. Usually you will find an explanation for the deployment failure somewhere along the bottom of the log. Common culprits may include git errors, RubyGem issues, a typo in your application’s custom Chef recipes, etc.

In this case the error is showing “Permission denied (publickey)”, which is often displayed as a result of failing to add your deploy key to your git repository.
 ###My application is still down
Hopefully the suggestions above will help you diagnose the source of your downtime so that you can get your application back up. Of course situations may also occur where no information on the Engine Yard Cloud Dashboard indicates any potential problems. So, what do you do in this case?
###Let’s get down and utilize SSH
Inspect application logs within your instance
Additional logs exist that are not viewable directly through your Dashboard. Since each Engine Yard Cloud instance corresponds to an actual Amazon EC2 instance, you can view files in your instance as you would on any other server.
The first place to check is your application’s logs under /data//current/log. The file production.log may point you in the right direction. Other log files in the same directories may lead you to a discovery as well.
What other processes can fail?
Another common problem can result from Nginx. Due to certain triggers, it is possible for Nginx to be terminated. To determine the Nginx status execute sudo /etc/init.d/nginx status. If the status indicates that Nginx has not started, you can run sudo /etc/init.d/nginix start to fix that. Then, recheck the status to verify you are good to go.
The same principle can be applied to MySQL. You can check the status with sudo /etc/init.d/mysql status and start MySQL with sudo /etc/init.d/mysql start. To check the status of Passenger, run passenger-status and you can restart passenger by restarting Nginix as passenger automatically restarts with passenger. You can also find other useful logs under /var/log, such daemon.log, syslog, etc. ###Wrapping up Downtime is frustrating. Luckily, there are many tools and resources to arm you with useful information to help diagnose and resolve downtime related issues. You can also check out the Site is down: diagnostic checklist on our documentation page for a more formal walk through.


Share your thoughts with @engineyard on Twitter