Profiling PHP Part 1: Intro to Xhprof & Xhgui

What is Profiling?
Profiling is measuring the relative performance of your application at the code-level. Profiling will capture things like CPU usage, memory usage, time and number of calls per function, as well as capturing a call graph. The act of profiling will impact performance.
This differs from benchmarking, as benchmarking is performed externally and will measure the actual performance: what your end-users will see.
When Should I Profile My Code?
The first thing to determine when you are thinking about profiling is: Do I have a performance issue? And then you need to quantify that and ask: How big of a problem do I have?
If you do not do this, you will fall into the trap of premature optimization, and it may well be a waste of your time.
To determine if you even have a problem, you should decide what your goal performance should be - for example, 100 concurrent users with less than 1s response times. Then you will need to benchmark to see if you are meeting that goal. One common mistake people make is benchmarking on your development or staging environment: you must perform the benchmark against production hardware (either actual production if you are not live, or a copy of it — the latter can easily be achieved in the cloud (see: Cloning your environment on Engine Yard Cloud.)
There are many options for benchmarking, including ab, siege and Jmeter. I personally prefer the feature-set of Jmeter, but ab and siege are much simpler to use.
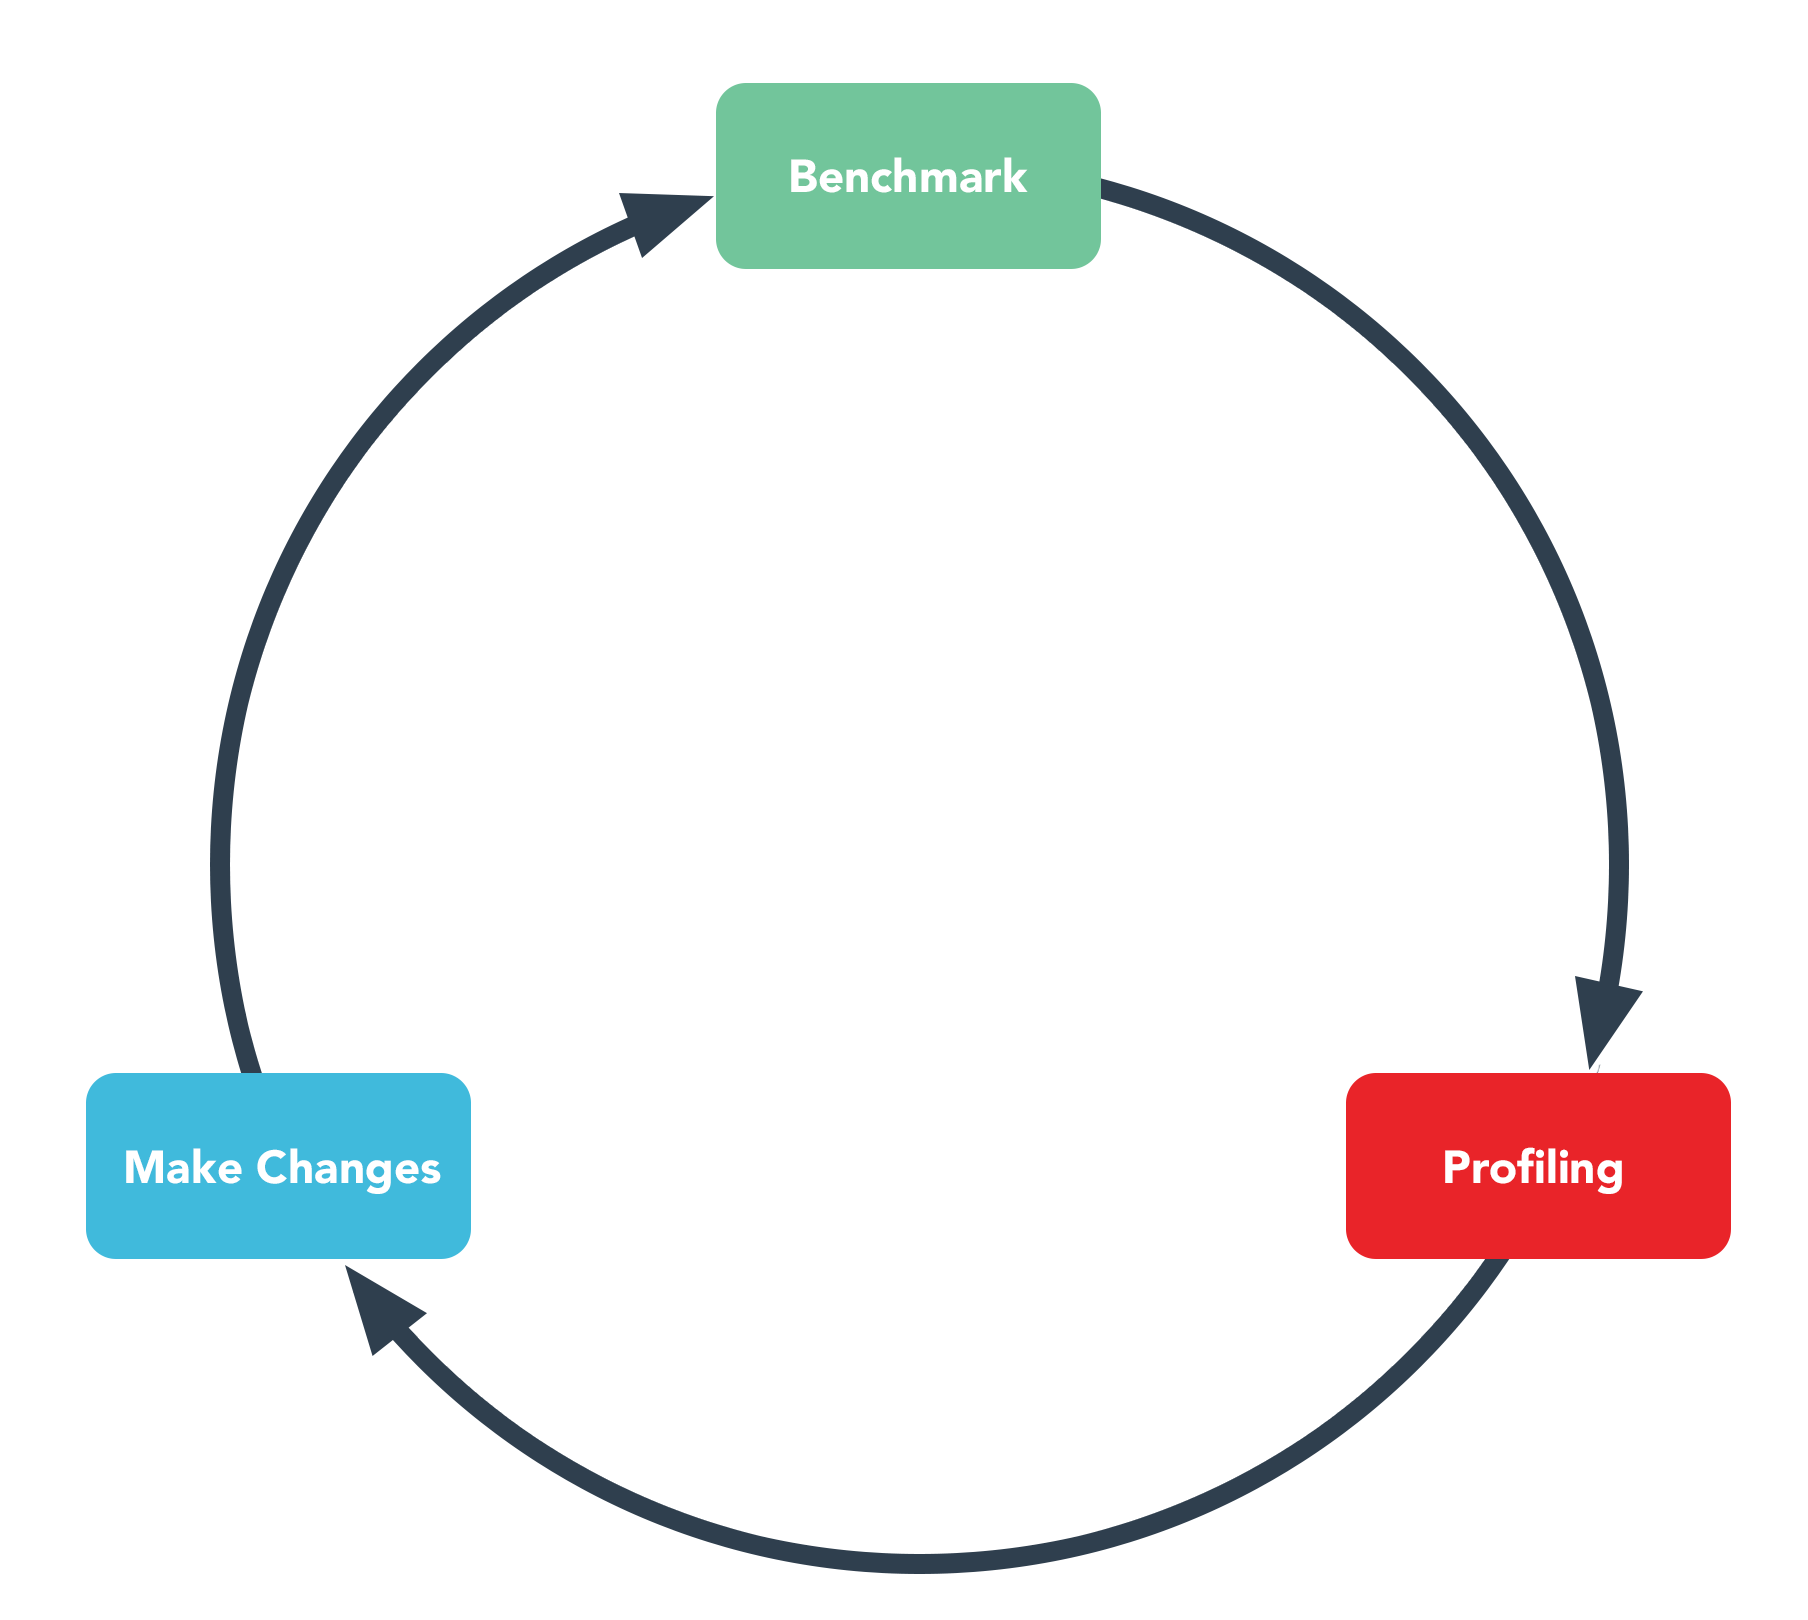
Once you have determined that you do indeed have a performance issue, then you should profile your code, make a fix, and then benchmark again to see if the issue has gone away. You should benchmark after every individual change. If you make many changes you might find that performance is negatively impacted and have no idea which specific change caused the problem.
I call this the Performance Lifecycle:

Common Causes of Slowdowns
There are a number of common causes for slow-downs. Contrary to what some people might think, even with a high-level language like PHP, code is rarely the issue. You are unlikely to be CPU-bound before other problems arise with today’s hardware. Some common causes are:
- Datastore
- PostgreSQL
- MySQL
- Oracle
- MSSQL
- MongoDB
- Riak
- Cassandra
- Memcache
- CouchDB
- Redis
- External Resources
- APIs
- Filesystems
- Network Sockets
- External Processes
- Bad Code
Which Profiler?
There are two distinct types of profilers in the PHP-world, active and passive.
Active vs Passive Profiling
Active profilers are used during development, and are enabled and initiated by the developer. Active profilers gather more information than passive profilers, but impact performance in a larger way — active profilers cannot be used in production scenarios. Xdebug is an active profiler.
Because of the inability to use active profilers in production, Facebook introduced a passive profiler, xhprof. Xhprof is built for usage in production environments. It has a minimal impact on performance while still gathering enough information to diagnose performance issues. Both xhprof and New Relic are passive profilers.
Typically, the additional data gathered by xdebug is not needed for general performance problems, meaning that passive profilers are a better option for always-on profiling, even during development.
Xhprof + Xhgui
Xhprof was created by Facebook, and includes a basic UI for reviewing profile data. Additionally, Paul Reinheimer has created Xhgui, an enhanced UI project for reviewing, comparing and analysing profile data.
Installing
Installing Xhprof
Xhprof is available via PECL, installation is as simple as:
$ pecl install xhprof-beta
The pecl command will try to update your configure php.ini automatically. The file that pecl will try to update can be found using the following command:
$ pecl config-get php_ini
It will simply add the new configuration lines to the top of the indicated file (if any). You may want to move them to a more appropriate location.
Once you have the extension compiled you must then enable it. To do so, you will need to add the following to your PHP INI file.
[xhprof]
extension=xhprof.so
We then combine this with Xhgui to easily perform the profiling, and review.
Installing Xhgui
To install Xhgui, we must do so directly from git; the project can be found on github at https://github.com/perftools/xhgui
Xhgui requires:
- PHP 5.3+
- ext/mongo
- composer
- mongodb (optional for collection, required for analysis)
First, clone the project wherever you want it to live. On Debian-based (e.g. Ubuntu, and others) Linux machines, this might be /var/www, on Mac OS X, this might be /Library/WebServer/Documents.
$ cd /var/www
$ git clone https://github.com/perftools/xhgui.git
$ cd xhgui
$ php install.php
The last command will run composer to install dependencies and check permissions on the xhgui cache directory. If it fails you can run composer install by hand.
Next, you may need to create your config, which is easily done by using the default config found in /path/to/xhgui/config/config.default.php.
If you are running mongodb locally, without authentication, you will likely not need to do this as it will fault back to the default. In a multi-server environment however, you will want a single remote mongodb server that all servers can store to, and will need to configure this appropriately.
To enhance the mongodb performance, you can add indexes by running the following:
$ mongo

> use xhprof
db.results.ensureIndex( { 'meta.SERVER.REQUEST_TIME' : -1 } )
db.results.ensureIndex( { 'profile.main().wt' : -1 } )
db.results.ensureIndex( { 'profile.main().mu' : -1 } )
db.results.ensureIndex( { 'profile.main().cpu' : -1 } )
db.results.ensureIndex( { 'meta.url' : 1 } )
Alternative Configuration
If you do not wish to install mongo in your production environment, or have difficulty enabling access from your web servers to the mongo server, you can save the profile data to disk and import it to a local mongodb for later analysis.
To do this, change the following in your config.php:
<?php
'save.handler' = 'file',
'save.handler.filename' => '/path/to/xhgui/xhprof-' .uniqid("", true). '.dat',
?>
Changing save.handler to file, then uncommenting save.handler.filename and setting an appropriate value.
Note: the default will only save one profile per day.
Once you are ready to analyze the data, you can import it using the script included with xhgui:
$ php /path/to/xhgui/external/import.php /path/to/file.dat
From this point on, the process is the same.
Running Xhgui
Xhgui is a PHP web application, you can setup a standard virtualhost using /path/to/xhgui/webroot as the Document Root.
Alternatively, you can simply use the PHP 5.4+ cli-server, like so:
$ cd /path/to/xhgui
$ php -S 0:8080 -t webroot/
This will make Xhgui available via port 8080 on all network interfaces.
Running the Profiler
To run the profile you need to include the external/header.php script on any page that you wish to profile. You can do this easily by setting the auto_prepend_file PHP ini setting. This can be done directly in the global INI file, or you can limit it to a single virtual host.
For Apache add the following to the <VirtualHost>:
php_admin_value auto_prepend_file "/path/to/xhgui/external/header.php"
For Nginx add the following to the server block:
fastcgi_param PHP_VALUE "auto_prepend_file=/path/to/xhgui/external/header.php";
If you are using the PHP 5.4+ cli-server (php -S) then you must pass the setting via the command line flag:
$ php -S 0:8080 -dauto_prepend_file=/path/to/xhgui/external/header.php
By default, the profiler will run on (approximately) 1% of runs. This is controlled by the following code snippet in external/header.php:
<?php
if (rand(0, 100) !== 42) {
    return;
}
?>
If you want to run it on every request (for example, when in development), you can simply comment this out. If you want it to run on ~10% of runs, you could change it to:
<?php
if (rand(0, 10) !== 4) {
    return;
}
?>
This allows you to profile a small portion of your users requests, not impacting an individual user too much, or too many users overall.
If you want to manually control when profiling occurs, you could use something like this:
<?php
if (!isset($_REQUEST['A9v3XUsnKX3aEiNsUDZzV']) && !isset($_COOKIE['A9v3XUsnKX3aEiNsUDZzV'])) {
  return;
} else {
  // Remove trace of the special variable from REQUEST_URI
  $_SERVER['REQUEST_URI'] = str_replace(array('?A9v3XUsnKX3aEiNsUDZzV', '&A9v3XUsnKX3aEiNsUDZzV'), '', $_SERVER['REQUEST_URI']);

  setcookie('A9v3XUsnKX3aEiNsUDZzV', 1);
}

if (isset($_REQUEST['no-A9v3XUsnKX3aEiNsUDZzV'])) {
  setcookie('A9v3XUsnKX3aEiNsUDZzV', 0, time() - 86400);
  return;
}
?>
This checks a randomly named GET/POST/COOKIE variable (in this case: A9v3XUsnKX3aEiNsUDZzV) and will set a cookie with the same name to allow for profiling all parts of the request — for example redirects after form submission, ajax requests, etc.
Furthermore, it allows for a no-A9v3XUsnKX3aEiNsUDZzV GET/POST value to remove the cookie and stop profiling.
Next Time…
In our next installment, we’ll take an in-depth look at Xhgui, the UI for reviewing and comparing data from xhprof.


Share your thoughts with @engineyard on Twitter